
Web Tool Service

A specialized oncology data analysis tool.
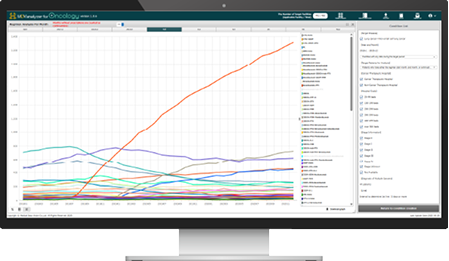
MDV analyzer for Oncology
An oncology-specific analysis tool designed for the MDV medical data platform, renowned for its ability to provide comprehensive cancer-related information. This tool supports the strategic market positioning of your drug by analyzing the share of treatment regimens used in real-world clinical settings by treatment line. It helps estimate the number of potential patients prior to label expansion and assists in planning the launch of new oncology products.
For inquiries, demo requests, etc.
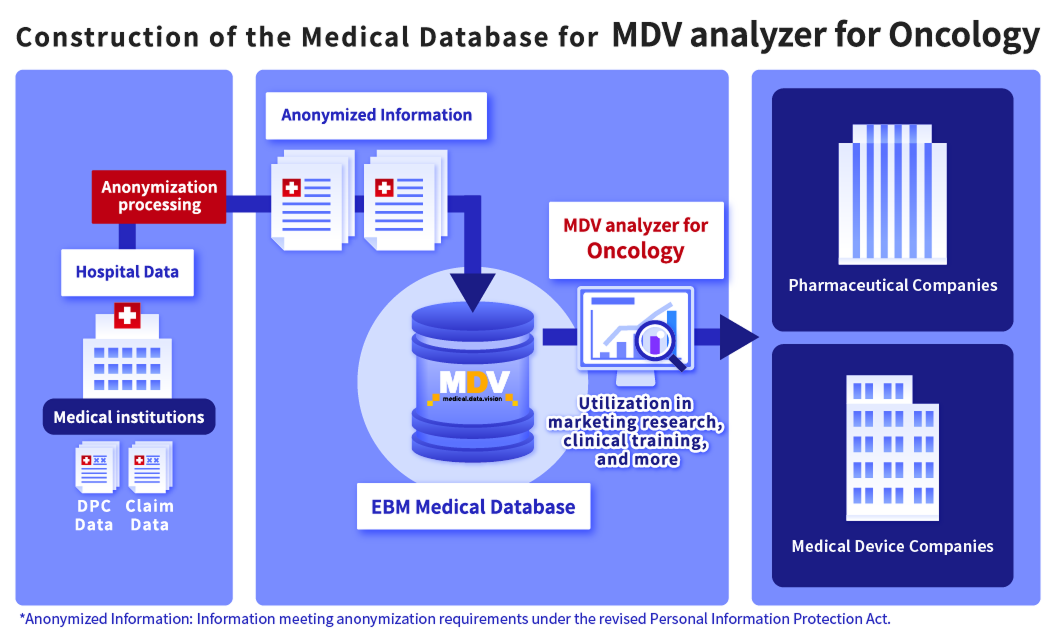
EBM Medical Database
This tool leverages anonymized data collected from medical institutions including DPC and medical claims (receipt) data collected and processed into a large-scale database. It is widely used by pharmaceutical companies, medical device manufacturers, and other healthcare-related businesses for purposes such as marketing research and clinical studies.
Feature Overview
MDV analyzer for Oncology allows fast and accurate analysis of complex treatment regimens. It helps oncology marketing teams conduct market research efficiently and provides robust support for R&D departments through detailed regimen pattern analysis.
Main Features of MDV analyzer
- Monthly Regimen Trend Analysis
- Treatment Duration per Regimen
- Regimen Pattern Analysis
- Treatment duration
- Regimen Specific Dose per Administration
Regimen Identification Using Japan’s Largest Hospital Database
Capturing the actual conditions of diseases, drug usage, and clinical procedures at each point in the timeline allows for the early detection of potential risks..
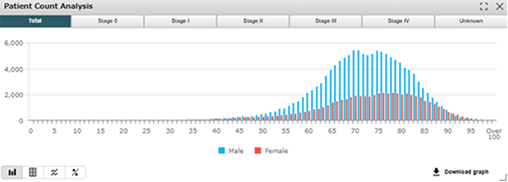
Stage-Based Patient Distribution
Aggregate patient count for selected cancer types by gender and age group to easily capture patient population distribution.
Regimen Share by Line of Therapy
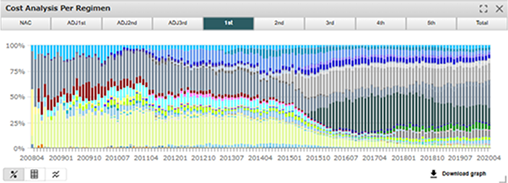
Analyze patient distribution across treatment regimens. Monitor shifts in treatment trends and assess real-world oncology practices with the latest data.
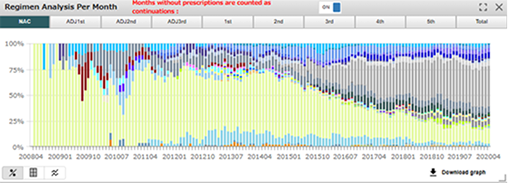
Analyzing regimen share by line of therapy—based on real-world clinical practice—enables strategic assessment of market positioning, evaluation of potential patient populations, and planning for label extensions or new product launches.
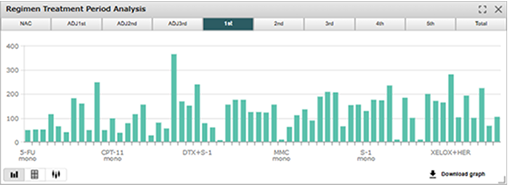
Analyzing treatment duration by regimen and line of therapy enables comparison of treatment lengths both across different lines for the same regimen and within the same line across different regimens.
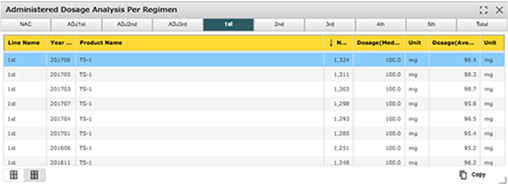
Average dose per prescription for each drug within a regimen can be analyzed by treatment line, allowing for detailed assessment of prescribing trends.
Analyzing patient counts by regimen pattern for a given cancer type shows you where your product is used and how it fits into treatment sequences.

For inquiries, demo requests, etc.
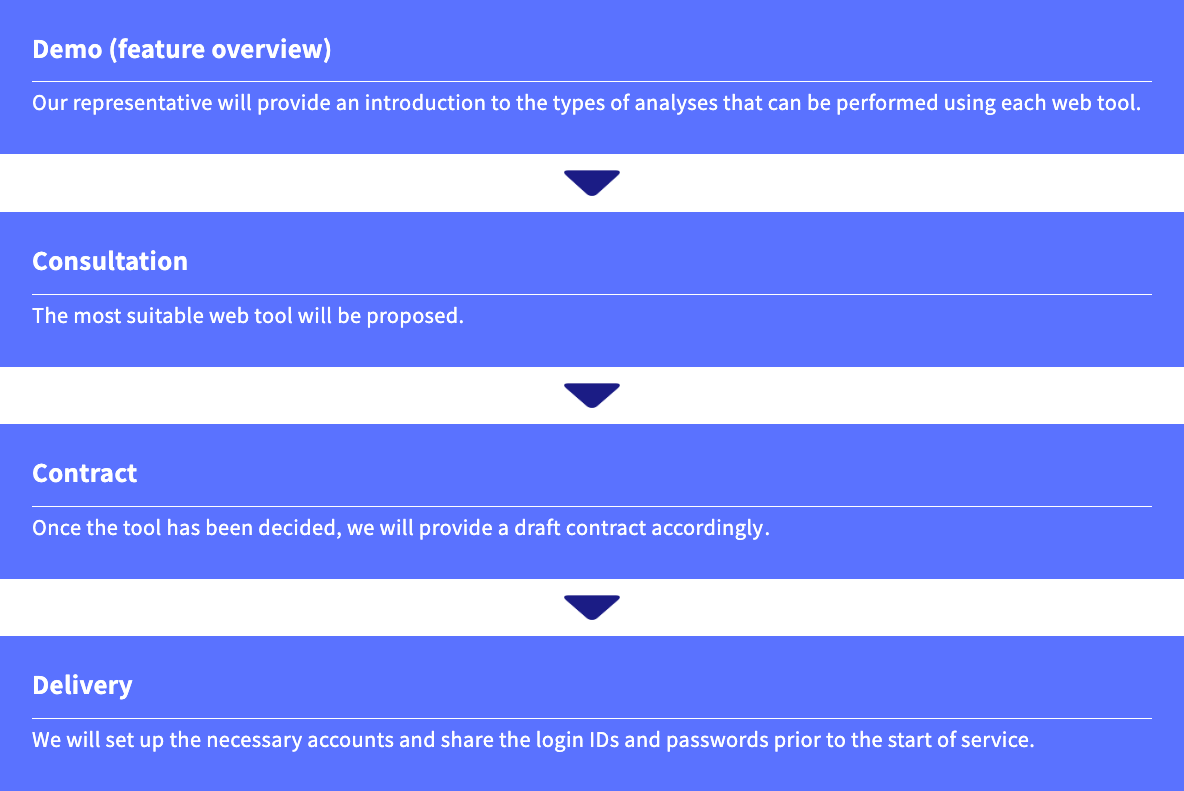
Main Steps to Get Started
FAQs
Before use
-
Q1. Is there a trial version for the web tool?
Currently, the web tool is not available for trial purpose. Our representative can provide an introduction to the web tool based on your specific requirements. Please feel free to contact us. -
Q2. Can you explain how to use the web tool before implementation?
Our representative can provide an introduction on how the web tool operates in advance. Please feel free to contact us. -
Q3. Are there any brochures that can be used for information sharing within our organization?
We have brochures for our web tool services. Please contact us if you are interested.
About the specifications
-
Q1. Are there any examples of major uses?
Marketing: Prescription trends, market analysis, etc.
Academia and pharmacovigilance: Exploring potential research, regulatory submission, etc.
R&D: Field research, assessing status of drugs with similar effects to those under development, etc. -
Q2. Does the data period include the latest data?
Maintenance is performed once a month, and the latest data becomes available after the maintenance. -
Q3. Can I disclose the data with external parties?
It is possible. However, prior to publication, we require a third-party disclosure agreement(TPA) with our company and a review of the materials to be published. -
Q4. Can the extracted results be used for regulatory submission?
We receive many disclosure requests every year, and the results are used not only for regulatory submissions but also during meetings with physicians. -
Q5. Are the results representative at the national level?
The data analysis uses actual values, and some features have been implemented to allow for extrapolation, enabling you to view national-level data. -
Q6. Is there a cost for adding accounts?
Within a single organization, there is no additional cost for using multiple accounts. -
Q7. Is it possible to use the service from home, such as during telework?
Yes, it is possible through a VPN connection or similar means. -
Q8. Are your services available in English?
Some of the web tools are available in English, please feel free to contact our representative for more information.
About the Hospital data
-
Q1. How many of the hospitals nationwide are DPC hospitals?
Currently, we have a coverage rate of approximately 30% of the 1,786 DPC-designated hospitals nationwide (as of December 31, 2024). -
Q2. Is the data limited to inpatient?
We collect insurance claim data for both inpatient and outpatient visits. -
Q3. Do DPC hospitals tend to have more patients with serious condition?
They are mainly advanced treatment hospitals, so they tend to have a higher number of patients with more severe conditions compared to clinics. However, there is also a significant number of patients in primary care areas, such as those with lifestyle-related diseases, and we receive many requests for analysis. -
Q4. Is the data representative?
Our data covers DPC hospitals nationwide, and the age and gender distribution of patients is similar to the survey published by the Ministry of Health, Labour and Welfare regarding the patient distribution in medical institutions across Japan. Therefore, it is considered to be representative. -
Q5. What are the advantages of this data?
Since it is the largest database in Japan with over 50 million patients, the data has been utilized in research in different fields, including intractable and rare diseases. -
Q6. How often is the data updated?
Update is performed at the end of every month, and the data two months prior to the update will be the latest data. (For example, the data of January 2021 will be available after the update performed at the end of March 2021) -
Q7. Is the database specialized in any disease area?
Given the large scale of the database, we are confident that we can secure a robust number of cases for research in any disease area. -
Q8. Is it possible to assess disease severity?
The web tool does not currently include data fields for assessing disease severity. However, through a separate service, it is possible to obtain data fields that allow for the assessment of severity in certain disease areas. -
Q9. Can the data be extrapolated to a national level?
There is a function in MDV analyzer that allows one to perform extrapolation to obtain results at the national level. -
Q10. Is it possible to track patients’ records even if they have been transferred to another hospital?
Each DPC hospital assigns a unique hospital-specific ID to each patient. Therefore, tracking is possible for both inpatient and outpatient data within the same DPC hospital. However, tracking after transfer to another hospital is not possible. -
Q11. Is it possible to obtain data for treatments that are not eligible for insurance reimbursement, such as out-of-pocket treatments?
Unfortunately, our database only includes medical information that is eligible for insurance reimbursement, as it is based on claim data.
For inquiries, demo requests, etc.
