

What is Data Analytics? Its Methods and How it Differs from Data Analysis
Advance in information technology lead to the development of technologies that make it possible to process large amounts of data, such as big data, and the need for data analytics is attracting attention in a variety of industries.
However, if you handle data without knowing the purpose of the analytics method or the appropriate analytics method for the data content, you will not be able to obtain valuable data analytics results.
Therefore, this column will provide a detailed explanation of data analytics, including specific methods and examples of initiatives at pharmaceutical companies.
What is Data Analytics?
Data analytics is the process of taking the results of data analysis and figuring out the causes and reasons why the results are the way they are.
There are various methods of data analytics, depending on the purpose of the analytics.
Data analytics is commonly used in the fields of AI and machine learning, but it is also widely used in business fields such as marketing, the medical field to measure the effectiveness of drugs, and the educational field.
The Difference from Data Analysis
A similar term to data analytics is “data analysis.”
Although the words sound similar to each other, there is a clear difference in purpose between the two.
First, let’s look at the difference in meaning between the words “analytics” and “analysis.”
- Analysis
To divide a matter into detailed elements in order to clarify its content, nature, etc. - Analytics
To analyze things and clarify them logically.
Each purpose of data analysis and data analytics is as described above.
Data analysis aims to divide the data into several elements.
On the other hand, in data analytics, the goal is to logically derive some answers from the divided elements.
For example, in a parent survey at a school, the “analysis” would include the work to acquire following results: “50% of the students’ grades improved, 20% of the students’ grades remained the same, and 30% of the students’ grades decreased.”
Based on the results, we can make hypotheses such as, “Is there a problem with the content of the class that 30% of the students’ grades have dropped?” The analytics is the process of making a hypothesis, and then pursuing the cause through further analysis.
By adding a deep consideration to the facts obtained from data analysis through data analytics, valuable information that is useful for businesses can be obtained.
Data Analytics Methods
Depending on the purpose and content of data analytics, there is a variety of analytics methods.
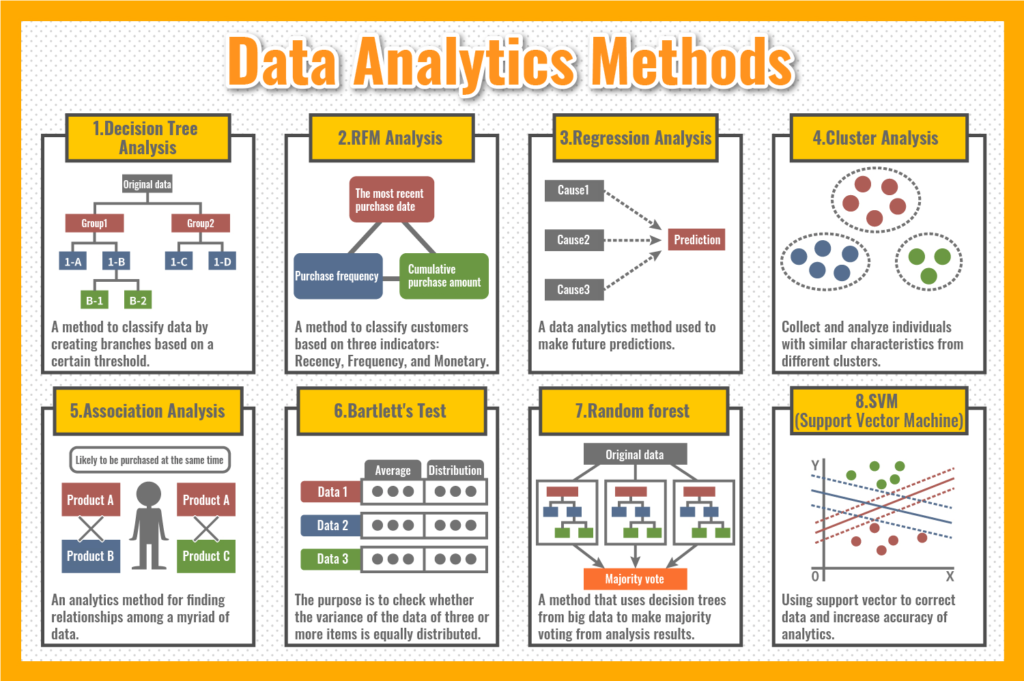
Now, we will discuss eight of the most common data analytics methods among the many available.
1. Decision Tree Analysis
Decision tree analysis is a method of analytics that combines “classification trees” and “regression trees” in a tree diagram.
A classification tree is to classify multiple conditions and the choices (yes/no) made under those conditions.
To illustrate with the example of joining a sports club, if you set multiple conditions for joining, such as “weekday use or weekend use, daytime use or nighttime use,” the selected results of the “Join/ Do not join” selection will be categorized according to each condition.
A regression tree is a hierarchical connection of a condition and a selected result with a new condition and a new selected result.
Using the example of joining a sports club above, weekday use -> 50 members joined -> nighttime use -> 30 members joined.
Decision tree analysis allows you to visually capture which elements are influencing how much and the degree of influence of each element.
2. RFM Analysis
RFM analysis, one of the methods of customer analytics, analyzes customers by grouping them using three indicators: the most recent purchase date (Recency), purchase frequency (Frequency), and cumulative purchase amount (Monetary).
The name RFM analysis is an alphabetical acronym for these indicators.
The purpose of grouping is to rank customers.
By ranking them, effective marketing measures according to each rank can be taken.
For example, sending a mailing promotion introducing recommended products to a group of customers who purchase frequently but have not made a recent purchase.
RFM analysis is also an effective analytics method for efficiently implementing marketing measures.
3. Regression Analysis
Regression analysis is a method of data analytics that is used to make predictions, using variables to determine which factors would produce which results.
The variable that represents the factor is called the explanatory variable, and the variable that represents the result is called the objective variable.
For example, if temperature changes are related to ice cream sales, you can use regression analysis to make ice cream sales predictions based on temperature changes.
Regression analysis has different methods depending on the number and type of variables, and there are various analytics methods such as single regression analysis, multiple regression analysis, and logistic regression.
There is an analytics method which is used not only in the field of business, such as sales and visitor prediction, but also in the field of medicine, such as disease prediction.
4. Cluster Analysis
Cluster analysis is a method of creating and analyzing clusters (groups) by collecting individuals with similar characteristics from an aggregate of different properties.
This analytics method is used to group and analyze people by internal factors such as “health-consciousness” or “anime fans,” rather than by external factors such as gender or age.
There are two types of cluster analysis: “hierarchical analysis,” which classifies small clusters into large clusters in the process of analytics, and “non-hierarchical analysis,” which assumes several clusters in advance and sorts them. Non-hierarchical analysis is commonly used in cluster analysis of big data.
5. Association Analysis
Association analysis is an analytical method for finding relationships among a myriad of data.
The reliability of a rule, such as “under the condition A, the conclusion B is reached,” is evaluated using the degree of support (the percentage of the total number of cases in which the rule occurs) and the degree of confidence (the percentage of cases in which the conclusion B is reached under the condition A).
There is a famous episode that illustrates association analysis: “When customers buy diapers, they also buy beer.”
As this episode shows, association analysis can uncover unexpected associations.
6. Bartlett’s Test
The Bartlett’s test aims to check whether the variance of the data of three or more items/groups is equally distributed.
When using analysis methods such as the T-test and ANOVA (analysis of variance) ,which are used in medical statistics, it is necessary to check the data distribution in advance using the Bartlett’s test, because these analyses are based on the assumption that the variance of the data is uniform.
A similar method to the Bartlett’s test is the F test, which examines whether the variances are equal for two items (two groups), but there is a difference in the number of items handled between the two tests.
7. Random Forest
In random forest, samples are randomly extracted from big data, and each sample is analyzed by using a decision tree.
It is an analysis method to make predictions by taking majority vote or an average from the results of each analysis.
The characteristic of this method is that it aims to achieve higher accuracy by combining and validating multiple analyses.
Since it is easy to implement, it is also a widely used data analytical method in machine learning.
8. SVM (Support Vector Machine)
Support vector machine, like random forest, is also used for analytics with high accuracy.
When doing predictive analytics with data, if you do data analytics with outliers in it, you may extract inaccurate results.
Therefore, support vector is used to correct the data, eliminate outliers, and then increase the accuracy of the analytics.
In the field of machine learning, support vector machine is also used as a highly accurate analytical method.
Data Analytics at Pharmaceutical Companies
Data analytics methods are widely used not only in the business field, but also in the fields of new drug development and verification of therapeutic effects.
This section will introduce how data analytics is being used in the field of pharmaceutical development.
Precision Medicine through the Utilization of Data
When the same drug is administered to patients with the same disease, the effects and side effects of the drug may vary from person to person.
Precision medicine is the concept of reducing this individual variability through data analytics to make treatment more effective for each individual.
As a utilization example, research is being conducted to analyze medical big data, such as human genome information and other biological information, to predict how the effects and side effects of drugs will vary depending on the characteristics of the individual.
It is expected that this research will be useful in administering appropriate therapeutic drugs that match the medical conditions and characteristics of individuals.
Utilizing Network Meta-analysis to Examine the Effects of Therapeutic Drugs
Network meta-analysis is an analytical method that has recently attracted much attention in the evaluation of pharmaceuticals.
It allows the comparison of three or more treatments at the same time, whereas the conventional method allows the comparison of two treatments. Therefore, this analytical method is utilized in some cases where there are many treatments to be evaluated.
As a utilization case, it is reported that an effort to verify the efficacy and safety of therapeutic drugs by analyzing based on the accumulated data of clinical trials on the treatment of bipolar disorder using network meta-analysis.
Data Analytics is a Necessary Method to Obtain Valuable Data
Data analytics is an indispensable method for obtaining useful data, as it allows us to explore the reasons and causes for the facts obtained from data analysis with additional insights.
For this reason, data analytics has been adopted not only in the business field, but also in the medical and pharmaceutical fields.
Medical Data Vision provides tools and services to support data analytics.
Please feel free to contact us for more information.
For More Information, Please Contact Us Here
About Japanese Healthcare System

What you need to know about the healthcare system in Japan before using the data.
SERVICE
In addition to various web tools that allow you to easily conduct surveys via a browser using our medical database, we offer data provision services categorized into four types to meet your needs and challenges: "Analysis reports" "Datasets," "All Therapeutic Areas Data Provision Service," and "Specific Therapeutic Areas Data Provision Service.
![]()
© Medical Data Vision Co., Ltd. All Rights Reserved.