MDV provides access to its servers with the online web tools.
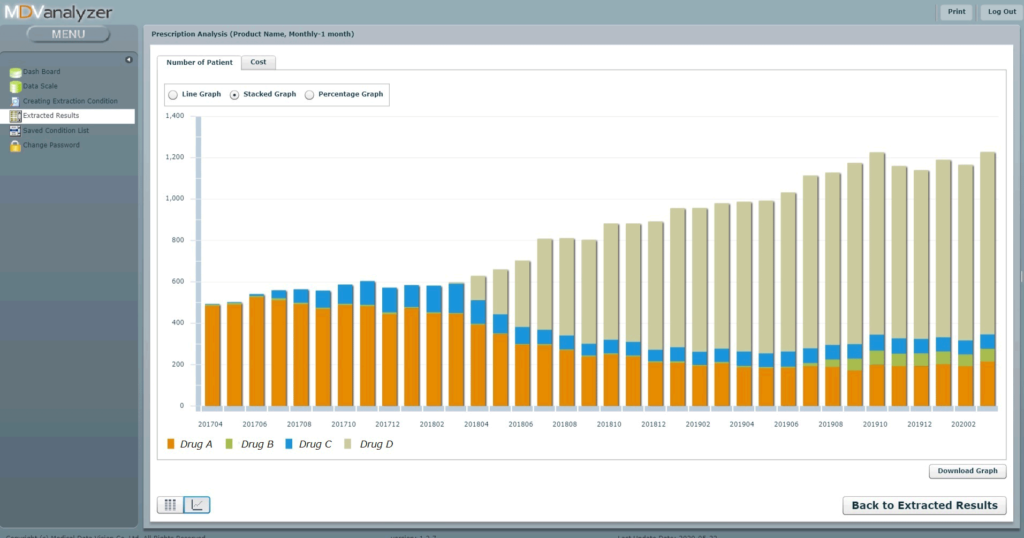
MDV analyzer
General web tool that will allow you to perform basic analyses such as number of patients, days of prescription, dosage & regimen, etc…
Main Functions:
- Number of patients
- Concomitant medication ranking
- Medication/Disease pattern analysis
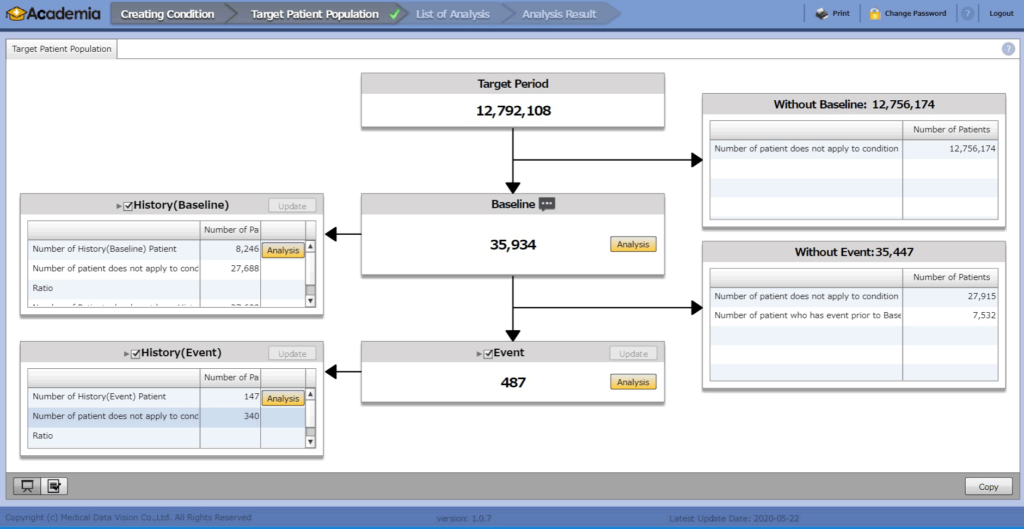
MDV analyzer for Academia
Academia is a customized web tool to analyze patient numbers based on patient’s baseline, event, and history.
Main Functions:
- Number of patients
- Number of days till event (histogram)
- Medication/Disease/Medical treatment ranking
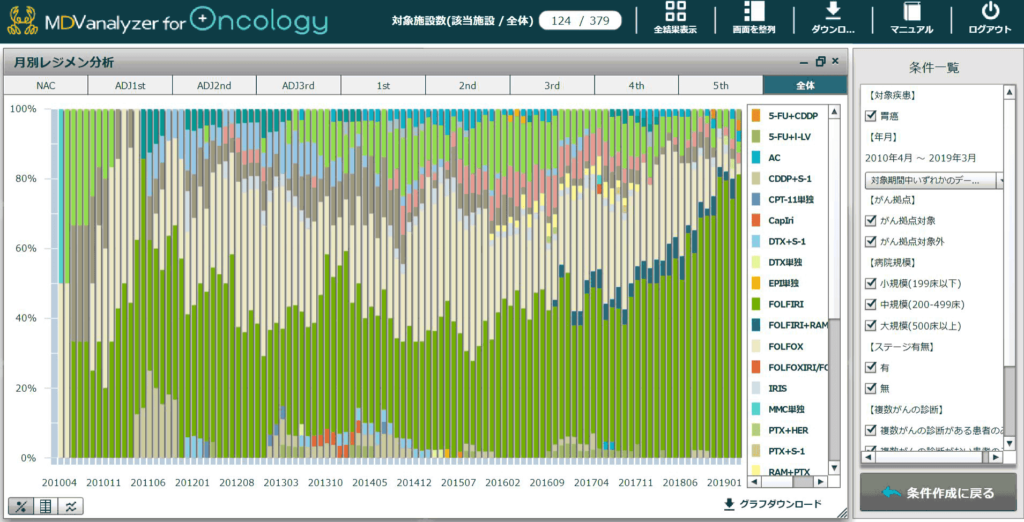
MDV analyzer for Oncology
It is a web tool specifically designed for the treatment of malignant tumors. It provides a detailed description of treatment by tumor site, a useful reference to confirm regimen prior to conducting clinical studies.
Main Functions:
- Monthly regimen analysis
- Treatment period of regimen analysis
- Regimen pattern analysis
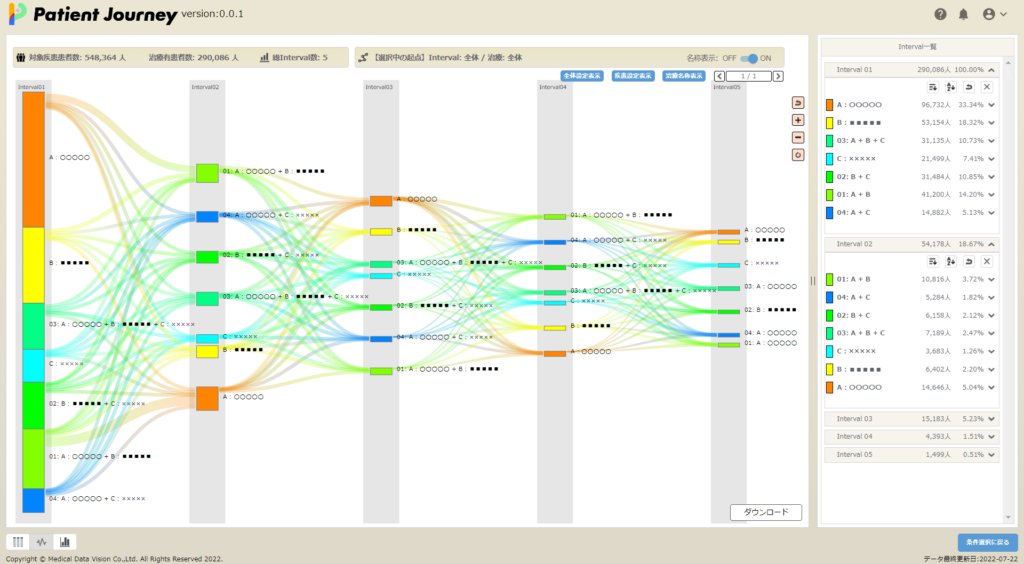
MDV analyzer for Patient Journey
MDV analyzer for Patient Journey is a WEB tool that uses the largest medical care database in Japan and applies Sankey diagram to visually check the main treatment flow. It can be used for a wide range of purposes from market research in marketing, feasibility research during clinical trials, or creation of real-world evidence to support regulatory submission for new products.
Main Functions:
- Patient flow diagram of target disease (Sankey Diagram)
- Histogram of treatment months/days
- Data table of treatment transition patterns
- Medication/Medical treatment ranking