



Analysis Conditions
- Target period: January 2021 – December 2025
- Target facilities: Hospitals for which all data for the specified months were available

Chronic hepatitis is a condition in which liver inflammation persists, often against a background of hepatitis B or hepatitis C virus infection. If left untreated, it may progress over the long term to liver cirrhosis and subsequently to hepatocellular carcinoma. Hepatocellular carcinoma accounts for the majority of primary liver cancers and is also among the leading causes of cancer death in Japan.
In recent years, in addition to molecular targeted agents such as sorafenib and lenvatinib, combination therapies including immune checkpoint inhibitors, such as atezolizumab plus bevacizumab and durvalumab plus tremelimumab, have become positioned as standard treatment options for first-line therapy. As a result, pharmacotherapy for advanced hepatocellular carcinoma has become increasingly diversified.
The Ministry of Health, Labour and Welfare has designated July 28 as “Japan Hepatitis Day” and the week including this day as “Liver Week,” making this a period when awareness of viral hepatitis and liver diseases tends to increase.
Therefore, using MDV analyzer and MDV analyzer for Oncology, we analyzed trends in the number of patients with chronic hepatitis and hepatocellular carcinoma, as well as real-world patterns of regimen-based treatment, based on MDV’s DPC data.
Analysis Conditions
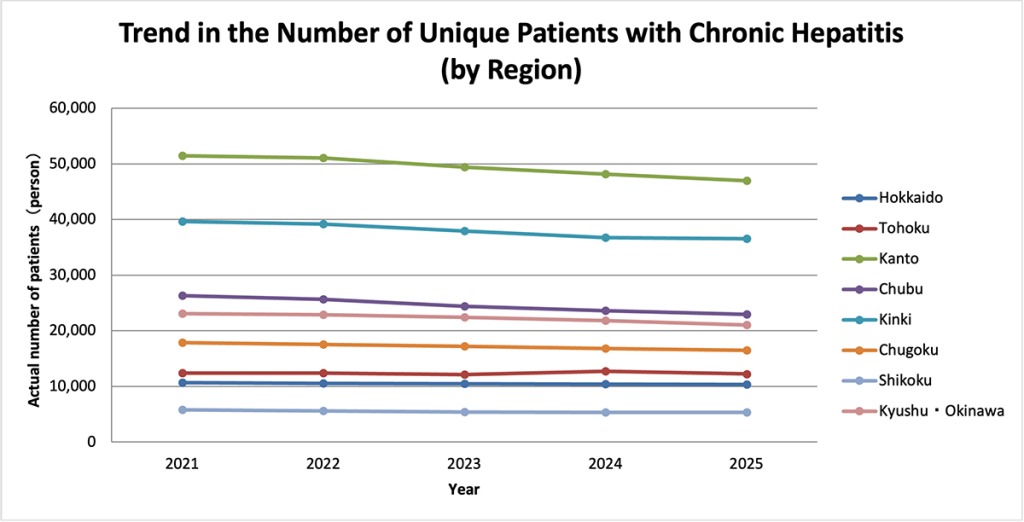
We analyzed regional trends in the number of patients with chronic hepatitis.
• Target period: January 2021 – December 2025
• Target facilities: Hospitals for which all data for the specified months were available
In terms of the absolute number of actual patients, the Kanto region had the largest number, decreasing from 51,487 patients in 2021 to 46,994 patients in 2025. This was followed by the Kinki region, which decreased from 39,636 to 36,568 patients, and the Chubu region, which decreased from 26,322 to 22,931 patients. The total number decreased from 187,270 to 171,982 patients.
Because the size of the patient population differs by region, we compared rates of change using an index with 2021 set at 100. On this basis, the Chubu region showed the largest decrease, with an index of 87.1, corresponding to a 12.9% decrease from 2021. This was followed by Kanto and Kyushu/Okinawa, both at 91.3, corresponding to an 8.7% decrease, and Shikoku at 91.4, corresponding to an 8.6% decrease. In contrast, Hokkaido remained at 97.1, corresponding to a 2.9% decrease, while Tohoku remained at 98.9, corresponding to a 1.1% decrease, indicating relatively smaller declines.
In absolute terms, the number of patients with chronic hepatitis was highest in large metropolitan regions such as Kanto and Kinki. However, because the size of the underlying patient population differs by region, trends in increase or decrease need to be assessed using an index-based relative comparison.
When viewed by index, decreases of approximately 8% to 13% were observed across a broad range of regions, including Chubu, Kanto, Kyushu/Okinawa, and Shikoku. In contrast, Hokkaido and Tohoku showed relatively smaller declines, indicating considerable regional variation.
Against the background of the widespread use of direct-acting antivirals (DAAs) for hepatitis C and long-term disease management using nucleos(t)ide analogues for hepatitis B, the number of patients with viral chronic hepatitis is considered to be on a nationwide downward trend. However, the pace of decline differs by region, and may be influenced by factors such as population dynamics and differences in healthcare delivery systems.
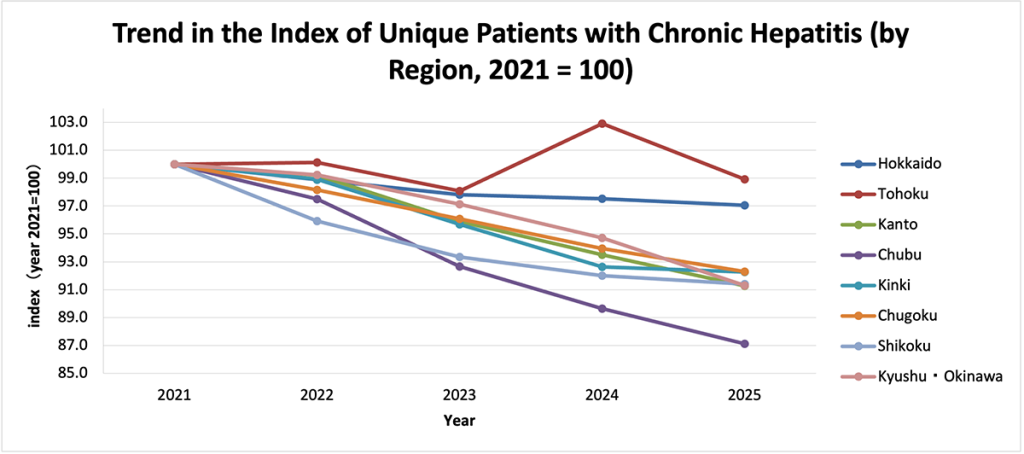
Reference: Indexed trends in actual patient numbers for chronic hepatitis by region, with 2021 set at 100.
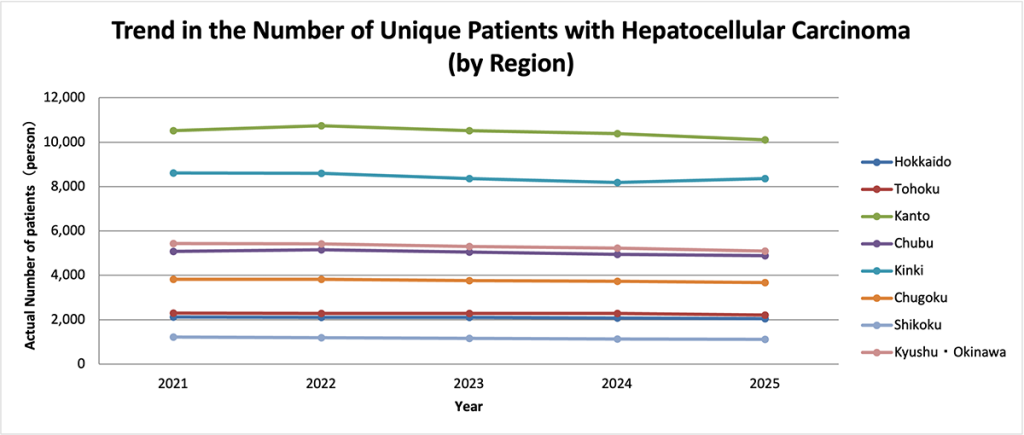
We analyzed regional trends in the number of actual patients with hepatocellular carcinoma.
• Target period: January 2021 – December 2025
• Target facilities: Hospitals for which all data for the specified months were available
In terms of the absolute number of actual patients, the Kanto region had the largest number, decreasing from 10,512 patients in 2021 to 10,105 patients in 2025. The Kinki region decreased from 8,613 to 8,358 patients, while the Chubu region decreased from 5,075 to 4,891 patients. Overall, the total number decreased gradually from 39,105 to 37,501 patients.
However, because the size of the underlying patient population differs by region, we compared rates of change using an index with 2021 set at 100. On this basis, Shikoku showed the largest decrease, with an index of 91.3, corresponding to an 8.7% decrease from 2021. This was followed by Kyushu/Okinawa at 93.8, corresponding to a 6.2% decrease, and Tohoku at 95.7, corresponding to a 4.3% decrease. In contrast, Kanto, which had the largest absolute number of patients, remained at 96.1, corresponding to a 3.9% decrease, while Kinki remained at 97.0, corresponding to a 3.0% decrease, indicating relatively smaller declines.
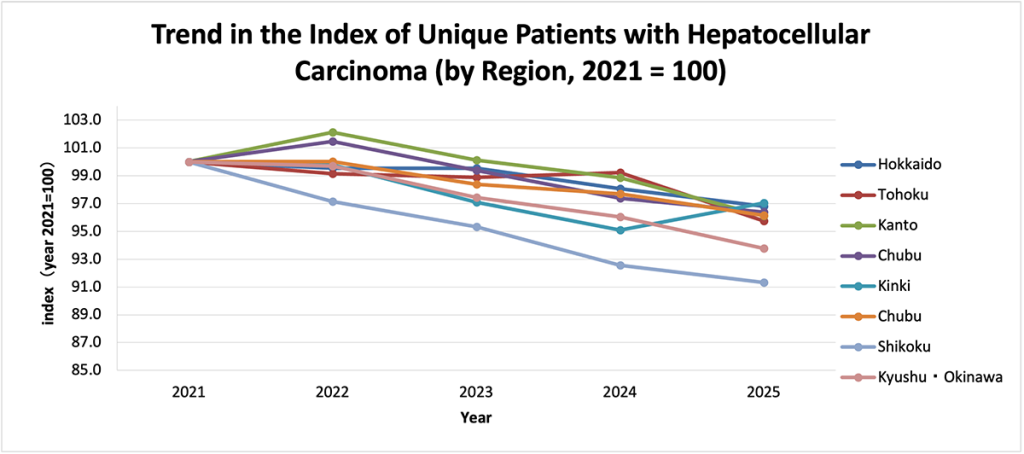
Reference: Indexed trends in actual patient numbers for hepatocellular carcinoma by region, with 2021 set at 100.
In absolute terms, the number of patients with hepatocellular carcinoma was highest in large metropolitan regions such as Kanto and Kinki. However, because the size of the underlying patient population differs by region, trends in increase or decrease need to be assessed using an index-based relative comparison.
When viewed by index, larger rates of decline were observed in regional areas such as Shikoku and Kyushu/Okinawa. In contrast, some large metropolitan regions showed signs of stabilization, including Kinki, where a slight increase was observed from 2024 to 2025.
While cases originating from viral hepatitis are declining, changes have been reported in the proportion of hepatocellular carcinoma cases associated with metabolic dysfunction-associated steatotic liver disease (MASLD), metabolic dysfunction-associated steatohepatitis (MASH, formerly NASH), and lifestyle-related diseases. In addition to changes in the composition of underlying causes, differences in the pace of population aging and in healthcare access by region may also be associated with the observed differences in relative rates of decline.
Next, we analyzed the number of patients and average treatment duration by regimen for each treatment line.
• Target period: January 2021 – December 2025
• Target facilities: Hospitals for which all data for the specified months were available
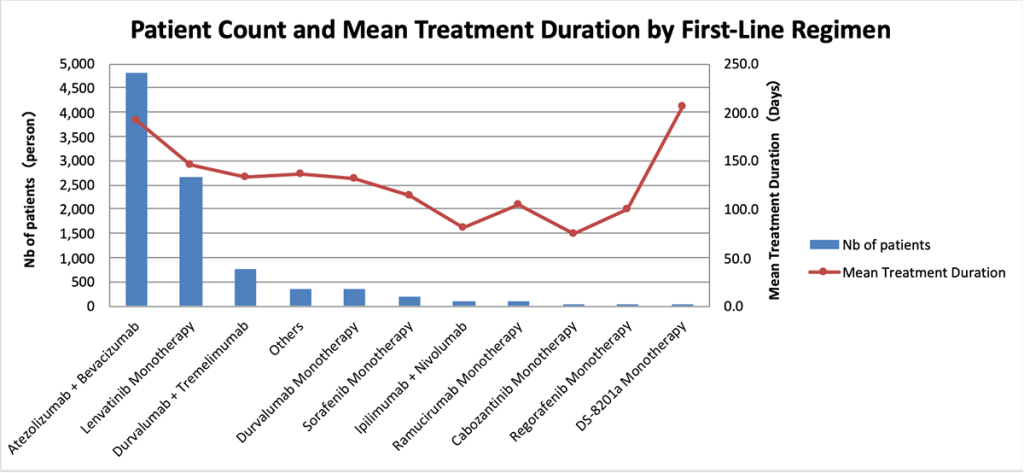
• Number of patients receiving first-line therapy: 9,417
In first-line therapy, atezolizumab plus bevacizumab was by far the most frequently used regimen, with 4,822 patients. This was followed by lenvatinib monotherapy with 2,670 patients and durvalumab plus tremelimumab with 766 patients.
The average treatment duration was 191.7 days for atezolizumab plus bevacizumab and 146.4 days for lenvatinib monotherapy. The total number of patients receiving first-line therapy was 9,417.
In first-line therapy, combination regimens including immune checkpoint inhibitors accounted for the largest share and exceeded molecular targeted agent monotherapy in actual use. Both regimens had an average treatment duration exceeding 100 days, suggesting that they were continued for a certain period as first-line treatment for advanced hepatocellular carcinoma.
Next, we analyzed the number of patients and average treatment duration by regimen for each treatment line.
• Target period: January 2021 – December 2025
• Target facilities: Hospitals for which all data for the specified months were available
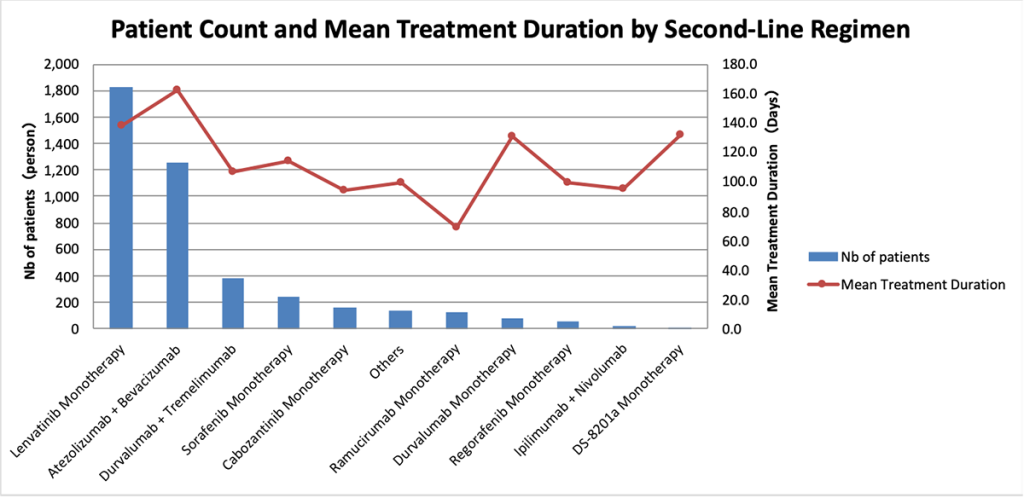
• Number of patients receiving second-line therapy: 4,296
In second-line therapy, lenvatinib monotherapy was the most frequently used regimen, with 1,823 patients, followed by atezolizumab plus bevacizumab with 1,253 patients.
The average treatment duration was longest for atezolizumab plus bevacizumab, at 162.4 days, while lenvatinib monotherapy had an average treatment duration of 138.4 days. The total number of patients receiving second-line therapy was 4,296, corresponding to 45.6% of the number of patients receiving first-line therapy, which was 9,417.
Second-line therapy included patients who transitioned from the treatment they had received in first-line therapy to other regimens, with lenvatinib monotherapy being the most frequently used. Atezolizumab plus bevacizumab also showed a long treatment duration in second-line therapy, which may reflect favorable treatment continuity.
When simply comparing the scale of patient numbers, the number of patients receiving second-line therapy corresponded to 45.6% of the number receiving first-line therapy. This suggests that a certain number of patients may not be able to continue treatment into later lines because of disease progression, adverse events, or other factors.
However, it should be noted that this figure is based on aggregation and comparison of the number of patients receiving treatment in each line, and does not represent patient-level tracking of treatment transitions.
• Target period: January 2021 – December 2025
• Target facilities: Hospitals for which all data for the specified months were available
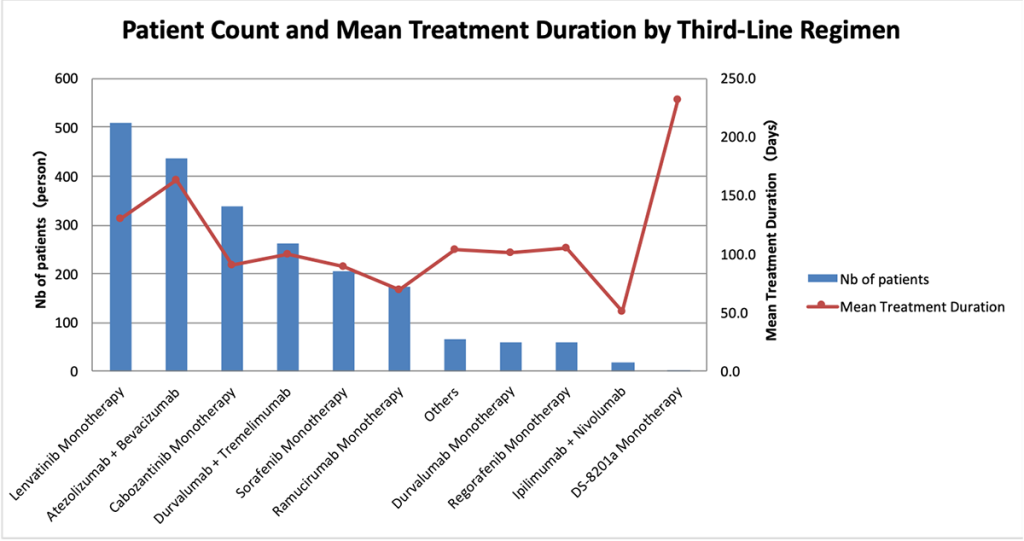
• Number of patients receiving third-line therapy: 2,128
In third-line therapy, lenvatinib monotherapy was the most frequently used regimen, with 509 patients, followed by atezolizumab plus bevacizumab with 435 patients and cabozantinib monotherapy with 337 patients.
The average treatment duration was 163.2 days for atezolizumab plus bevacizumab and 90.3 days for cabozantinib monotherapy. The total number of patients receiving third-line therapy was 2,128, corresponding to 49.5% of the number of patients receiving second-line therapy, which was 4,296.
By third-line therapy, the overall number of patients had decreased substantially compared with first- and second-line therapy. Drugs that are often selected in later-line treatment, such as cabozantinib monotherapy and sorafenib monotherapy, were also included among the higher-ranking regimens to a certain extent.
Atezolizumab plus bevacizumab continued to show a long treatment duration even in third-line therapy, suggesting that it may be a regimen that is relatively likely to be continued regardless of treatment line.
Across treatment lines, the number of patients receiving second-line therapy corresponded to 45.6% of the 9,417 patients receiving first-line therapy, while the number of patients receiving third-line therapy corresponded to 49.5% of the second-line population, or approximately 23% of the first-line population. This confirms a trend toward decreasing patient numbers as treatment lines progress.
It should be noted, however, that this comparison reflects the relative scale of patient numbers in each treatment line and does not directly indicate patient-level treatment transition patterns.
Note: This article was published on August 3 , 2026.
Data survey and analysis tailored to your specific requests
Databases, data analysis requests, and more.

© Medical Data Vision Co., Ltd. All Rights Reserved.
